Population Pyramid
The population pyramid report type allows to display a central graph like population pyramid.
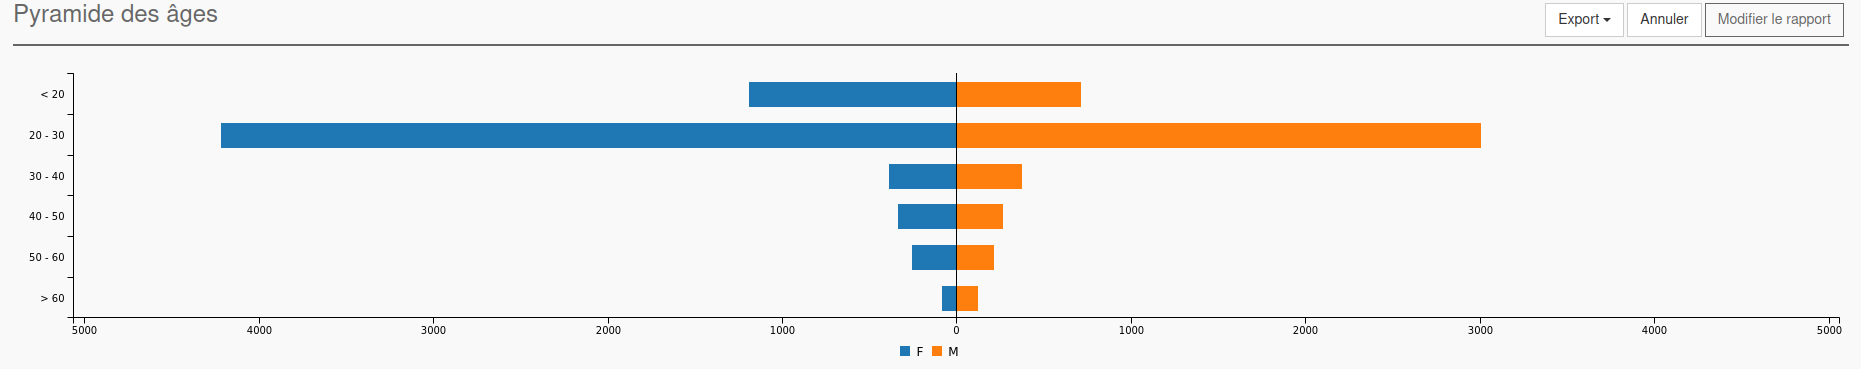
Example of a population pyramid report
There are three different places where you can put your columns:
- Metrics
This is the datas that will be analyzed and display in separated way.
- Dimension column
This is the column where you can put the field that will divide the results into different categories.
- Filters
These are regular filters and work the same as for other report types.
Report settings
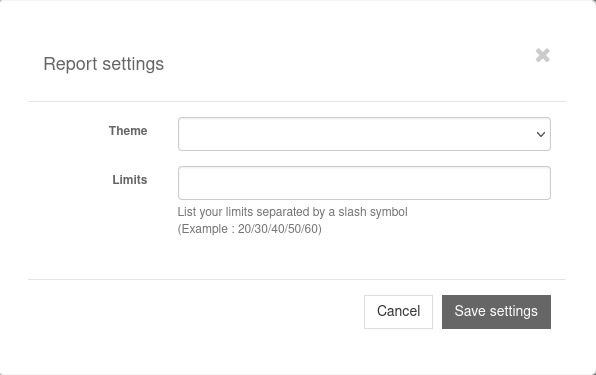
Screenshot of the pyramid report settings modal window
Here you can easily indicate limits (range) for your datas separating by ‘/’.